Your site feels slow. Maybe a customer mentioned it, maybe you noticed it yourself on your phone, or maybe you ran some tool that spat out a number in the 40s and turned half the screen red.
The problem with most speed testing advice is that it stops at the diagnosis. You get a score, a list of angry-looking warnings, and no real sense of which of them actually matter for your business versus which are technical noise you can safely ignore. This guide covers both halves: how to test your site’s speed properly, and what to actually do with the results.
(Quick note: if you’re looking for a test of your internet connection speed — your Wi-Fi or broadband — that’s a different thing entirely. Tools like Speedtest.net or Fast.com handle that. This article is about how fast a website loads for its visitors.)
Why site speed actually matters
Two reasons, and they compound.
Visitors leave. Every additional second before your page becomes usable is another moment where someone can decide they’re not waiting. This effect is harshest on mobile, where connections are less reliable and patience is shorter. If you’re running paid ads, this gets expensive fast — you’re paying for a click, and then losing the visitor before they see anything you paid to show them.
Search engines notice. Google uses page experience signals, including load speed metrics, as a ranking factor. It’s not the biggest factor — relevant content still wins over fast content — but between two comparably relevant pages, the faster one has an advantage. And slow pages compound the problem: if visitors bounce quickly, that behavior signals dissatisfaction back to search engines.
The practical takeaway: speed isn’t a vanity metric. It’s directly tied to how many people who arrive actually stay, and how many arrive in the first place.
The tools worth using
There are dozens of speed testing tools. You need two or three, not ten.
Google PageSpeed Insights
Best for: the metrics that actually affect your search rankings.
This is the one to start with, because it reports Core Web Vitals — the specific speed metrics Google uses in ranking. It also has a critical advantage over most other tools: it shows both lab data (a simulated test run right now) and field data (real measurements from actual Chrome users who visited your site over the past 28 days, if you have enough traffic to qualify).
That distinction matters more than most people realize. Lab data is a controlled test; field data is what your actual visitors actually experienced. When they disagree, field data is the one that counts.
GTmetrix
Best for: understanding why something is slow.
GTmetrix gives you a waterfall chart — a visual timeline of every single file your page loads, in order, with how long each took. This is where you find the actual culprit: the 4MB hero image, the third-party chat widget adding two seconds, the font file loading from a slow server. PageSpeed Insights tells you that you have a problem; the waterfall usually tells you exactly which file caused it.
Pingdom
Best for: checking speed from different geographic locations.
If your customers are in one country and your server is in another, load times can differ dramatically from what you experience locally. Pingdom lets you test from multiple regions, which surfaces problems that are invisible when you’re testing from down the street from your own server.
WebPageTest
Best for: deeper technical diagnosis.
More advanced and less friendly than the others, but far more configurable — test on specific device types, throttled connection speeds, or run multiple passes to see how caching behaves on a repeat visit. Worth reaching for when the simpler tools have told you what is slow but you need to understand the specific conditions under which it gets worse.
How to run a test properly
Most people run one test, on their desktop, from their office, and take the number at face value. That number is often the least representative measurement you could have taken.
Test mobile separately, and take it more seriously. Most tools default to desktop or report both. Mobile is usually where the real problem lives — weaker processors, slower connections, and typically the majority of your traffic. If desktop scores 90 and mobile scores 45, you have a mobile problem, not a “pretty good” site.
Test more than your homepage. Homepages often get optimization attention that inner pages never receive. Test the pages that actually matter to your business: your top-converting landing page, a product page, your most-visited blog post. It’s common to find that the homepage is fine and a critical conversion page is twice as slow.
Run each test a few times. Single results fluctuate based on server load, network conditions, and caching state. Three runs give you a much better sense of the real number than one.
Test from where your customers are. If you serve one region and test from another, you’re measuring the wrong thing.
Don’t chase a perfect score. A score of 100 is an achievement in optimization, not a business requirement. Getting from 40 to 75 will meaningfully improve your visitors’ experience; going from 90 to 98 usually will not be noticeable to anyone. Diminishing returns arrive quickly at the top of the scale.
Understanding what the results actually mean
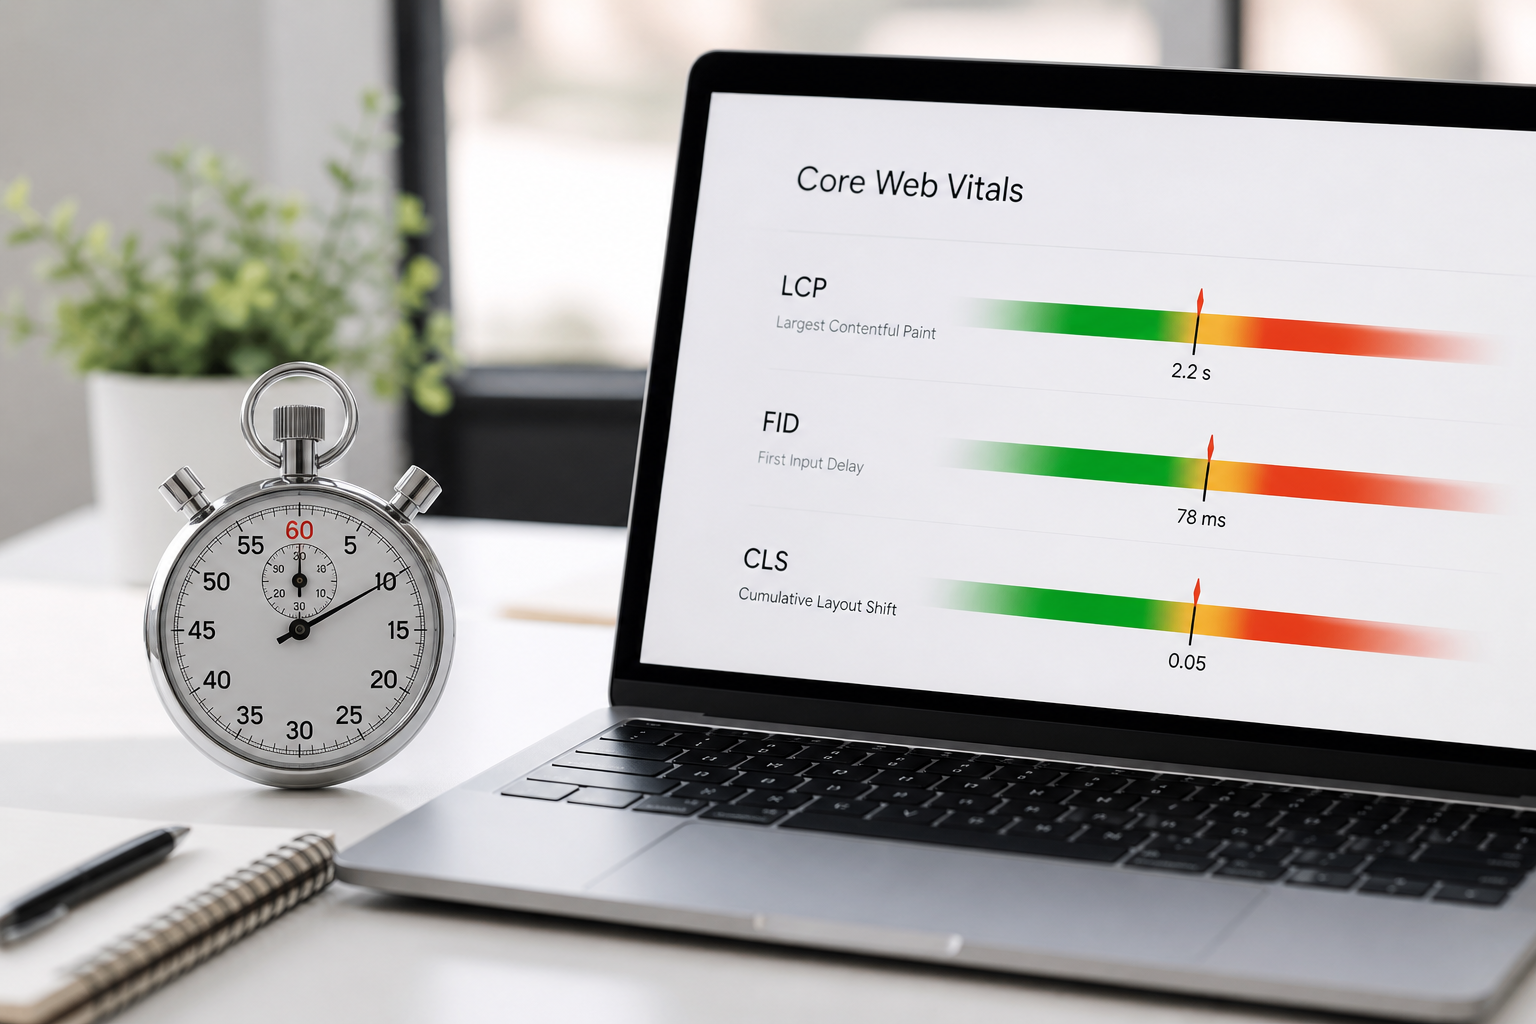
Speed tools throw a lot of metrics at you. Three matter most, and they’re the ones Google actually uses.
Largest Contentful Paint (LCP)
What it measures: how long until the biggest visible element on screen — usually a hero image or headline block — finishes loading.
Target: under 2.5 seconds.
Why it matters: this is the closest proxy for “when does the page feel like it has loaded” from the visitor’s perspective. It’s usually the metric with the most room for improvement, and usually the one that image optimization fixes.
Interaction to Next Paint (INP)
What it measures: how quickly the page responds when someone actually interacts with it — clicks a button, opens a menu, types in a field. It replaced the older First Input Delay (FID) metric in 2024.
Target: under 200 milliseconds.
Why it matters: a page can appear loaded while still being unresponsive — you click and nothing happens for a beat. That’s usually heavy JavaScript blocking the main thread. This is the metric that catches “it looks ready but it doesn’t work yet.”
Cumulative Layout Shift (CLS)
What it measures: how much the page jumps around while loading.
Target: under 0.1.
Why it matters: this is the one everyone has experienced and nobody knows the name of — you go to tap a link, an ad or image finishes loading above it, the page shifts, and you tap something else entirely. It’s infuriating, and it’s almost always caused by images or embeds without reserved space in the layout.
The lab vs. field distinction, again
Worth repeating because it trips up so many people: if PageSpeed Insights shows a poor field score but a good lab score, believe the field data. Lab tests run under ideal simulated conditions. Field data is your real visitors on their real phones with their real connections. A good lab score with bad field data means the test conditions were kinder than reality.
What actually fixes slow load times
Here’s the part most guides skip. Fixes ordered roughly by how much improvement you’ll get per unit of effort.
1. Images — almost always the biggest win
If your site is slow and you only fix one category of problem, fix this one. Images are typically the largest files on a page by a wide margin, and they’re usually unoptimized because uploading a photo straight from a phone or camera is the path of least resistance.
What to do:
- Compress everything. Most images can be reduced 60–80% in file size with no visible quality loss. Tools like TinyPNG, Squoosh, or ImageOptim handle this in seconds.
- Serve modern formats. WebP (and increasingly AVIF) produce substantially smaller files than JPEG and PNG at equivalent visual quality, with browser support that’s now effectively universal.
- Size images correctly. A 4000px-wide image displayed in a 800px-wide container is downloading five times more data than it needs. Resize before uploading.
- Lazy load below-the-fold images. Images further down the page shouldn’t block the initial load — they can load as the visitor scrolls toward them. Modern browsers support this with a single HTML attribute (
loading="lazy"). - Reserve space to prevent layout shift. Specify width and height attributes so the browser knows how much room to leave before the image arrives — this is the direct fix for most CLS problems.
2. Cut what you don’t need
Every third-party script — analytics, chat widgets, heatmaps, social embeds, marketing pixels, A/B testing tools — costs load time. Most sites accumulate these over years and never remove any.
What to do:
- Audit every third-party script and ask whether it’s still earning its cost. That heatmap tool nobody’s checked in eighteen months is still slowing down every page load for every visitor.
- Load non-critical scripts asynchronously or deferred, so they don’t block the page from rendering while they fetch.
- Watch for chat widgets and video embeds specifically — these are common heavy offenders.
- On WordPress and similar platforms: audit plugins. Many load their own CSS and JavaScript on every page whether or not the page uses their functionality.
3. Enable caching
Caching lets returning visitors load your site from files already stored on their device instead of re-downloading everything. It’s mostly a configuration task rather than an ongoing effort, and it makes repeat visits dramatically faster.
Server-level caching (or a caching plugin on WordPress) also reduces work your server does per request, which helps under traffic.
4. Use a CDN
A content delivery network stores copies of your site’s static files on servers around the world, so visitors download from a nearby location rather than from wherever your origin server happens to live. If your audience is geographically spread out — or simply far from your server — this is one of the highest-impact single changes available.
5. Fix fonts
Custom web fonts are easy to overlook and surprisingly costly. Each font weight and style is a separate file download, and fonts loading late cause visible text flashing or shifting.
What to do:
- Limit yourself to the weights you actually use. Loading nine weights of a font family when your design uses two is pure waste.
- Use
font-display: swapso text renders in a fallback font immediately rather than staying invisible while the custom font loads. - Self-host fonts where practical instead of pulling them from a third-party server on every load.
6. Reconsider your hosting
This is the least convenient item on the list, and sometimes the most important. Cheap shared hosting means your site shares server resources with many other sites, and server response time (Time to First Byte) suffers accordingly. If your speed tests show a slow initial server response before any of your content even starts loading, no amount of image optimization will fix that — the bottleneck is upstream of everything else.
A realistic order of operations
If you’re starting from a slow site and want a practical sequence:
- Run a baseline test in PageSpeed Insights, mobile view, on your three most important pages. Write down the numbers so you can verify improvement later.
- Look at the waterfall in GTmetrix for the slowest page. The biggest files will be visually obvious.
- Fix images first. Compress, convert to WebP, resize, add lazy loading and dimensions. This alone frequently moves scores substantially.
- Audit and remove unnecessary third-party scripts. Be ruthless about anything nobody actively uses.
- Enable caching, and add a CDN if your audience is geographically distributed.
- Retest. Compare to your baseline numbers.
- Then, and only then, consider whether deeper technical work (code-level optimization, hosting migration) is worth the investment for the remaining gap.
Most sites see the majority of their available improvement in steps 3 and 4.
When to hire someone
Plenty of speed work is genuinely DIY-able — compressing images and deleting an unused plugin doesn’t require a developer. It’s worth bringing in help when:
- The bottleneck is server response time and you need a hosting migration handled without breaking things
- The slowness is coming from your site’s actual code rather than its content
- You’ve done the accessible fixes and are still failing Core Web Vitals
- The site is complex enough (large ecommerce catalog, custom application) that changes carry real risk
- You want it monitored over time rather than fixed once and left to drift
That last point deserves emphasis: site speed regresses. A new plugin, a redesign, a marketing team adding a tracking script — performance quietly erodes unless somebody’s watching. Fixing speed once and never checking again means being back where you started in a year.
The short version
- Test with PageSpeed Insights first (it reports the metrics Google actually uses), then GTmetrix to find the specific culprit
- Test mobile, test multiple pages, run each test a few times, and trust field data over lab data
- Aim for LCP under 2.5s, INP under 200ms, CLS under 0.1 — don’t chase a perfect score
- Fix images first; it’s the biggest win on most sites by a wide margin
- Then cut unused third-party scripts, enable caching, and add a CDN
- Re-test against your baseline, and check periodically, since speed drifts back over time
If you’d rather have this handled properly — audited, fixed, and monitored so it doesn’t regress — that’s what our Performance Optimization service covers.

Plenox Studio
Engineering notes from Plenox Studio on performance, Core Web Vitals, and keeping sites fast after launch.